Every year, investors ask the same question — “Which mutual fund gave the highest return last year? Let me invest in that!” It sounds logical. If a fund manager performed brilliantly last year, surely they will do well again, right? We decided to put this popular belief to the test. We analysed 10 years of actual return data (2016 to 2025) across 100+ large cap and index funds — direct plans — and the results are eye-opening.
1. What Does the Data Say? (2016–2025 Overview)
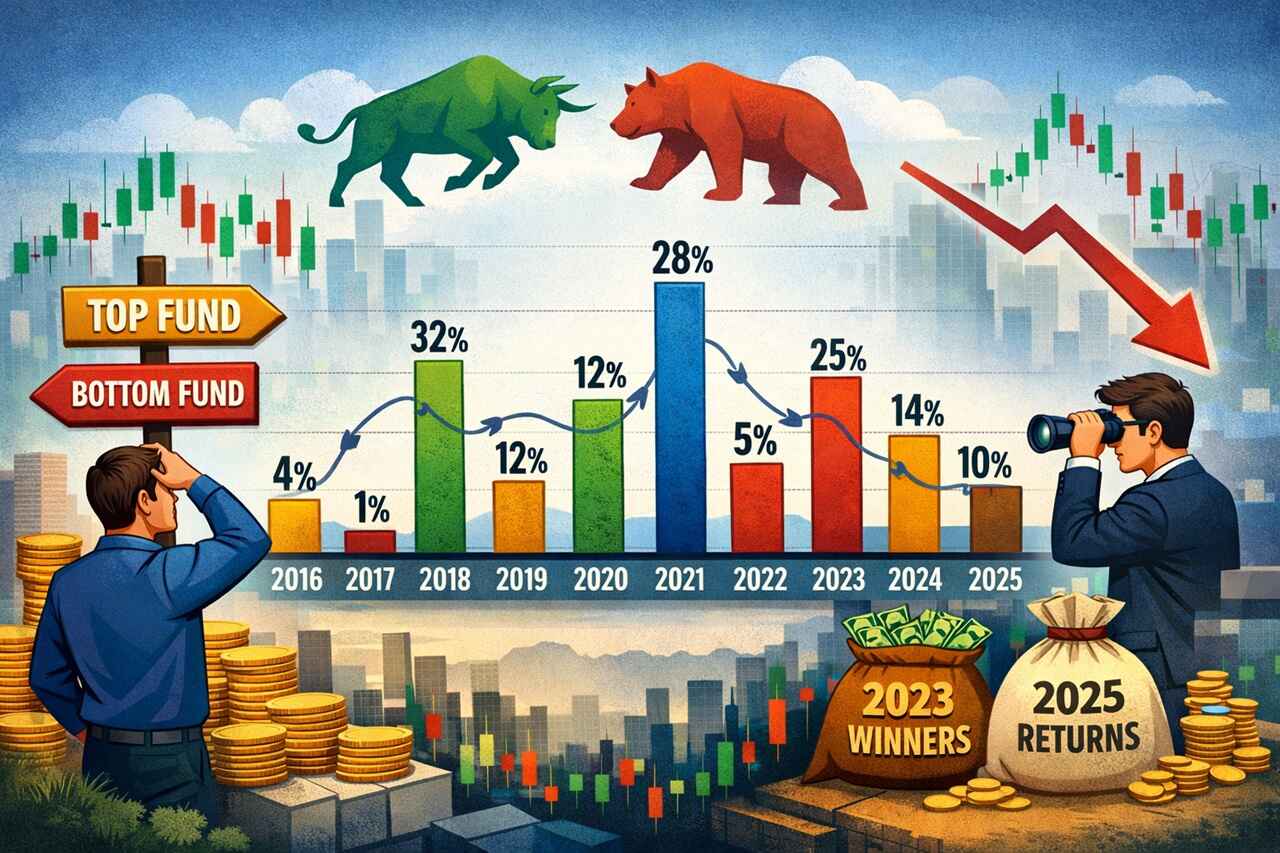
We studied returns across large cap funds and Nifty 50/Next 50 index funds from 2016 to 2025. Here is how the average returns across the category moved year by year:
| Year | Category Avg Return | Market Context |
|---|---|---|
| 2016 | ~4–5% | Demonetization shock |
| 2017 | ~32–33% | Strong bull run |
| 2018 | ~1–2% | NBFC crisis, correction |
| 2019 | ~11–13% | Slow recovery |
| 2020 | ~14–16% | COVID crash + V-shaped recovery |
| 2021 | ~27–28% | Massive post-COVID rally |
| 2022 | ~4–5% | Rate hike fears, caution |
| 2023 | ~24–25% | Broad-based strong rally |
| 2024 | ~14–16% | Election year, selective gains |
| 2025 | ~9–10% | Consolidation, slowdown |
Key Observation: Every high-return year was followed by a significantly lower-return year. This is not a coincidence — it is a well-documented financial phenomenon called mean reversion.
2. The “Top Fund Curse” — What Happens to Last Year’s Winners?
We tracked the Top 5 funds from each year and checked where they ranked the following year. The results were consistent across the decade:
- Top 5 funds from 2017 (bull year) → dropped to average or below-average ranks in 2018
- Top 5 funds from 2021 (rally year) → significantly underperformed in 2022
- Top 5 funds from 2023 (strong year) → fell sharply in 2024 and further in 2025
Why? Because:
- High-return years are driven by specific sector bets (PSU, infrastructure, equal-weight strategies) that don’t repeat
- A fund manager who took concentrated risks to top the charts often gets punished when that sector cools
- The market rotates — what worked last year often underperforms this year
3. 2023’s Star Performers — Where Are They in 2025?
2023 was a fantastic year for Indian equity funds. Let us look at how the top performers from that year have fared since:
| Fund | 2023 Return | 2024 Return | 2025 Return |
|---|---|---|---|
| ICICI Pru BHARAT 22 FOF | 58.6% | 17.7% | 9.8% |
| Nippon India Large Cap Fund | 33.2% | 19.1% | 10.1% |
| HDFC Large Cap Fund | 30.8% | 12.2% | 8.6% |
| Quant Focused Fund | 30.3% | 13.2% | 3.4% |
| Bandhan Nifty100 Low Vol 30 Index | 30.7% | 11.5% | 10.9% |
| DSP Nifty 50 Equal Weight Index | 30.4% | 10.2% | 14.3% |
| Invesco India Largecap Fund | 29.6% | 21.5% | 6.9% |
| Baroda BNP Paribas Large Cap | 26.3% | 21.3% | 5.6% |
Notice a clear pattern?
- The BHARAT 22 FOF delivered 58.6% in 2023 — an outlier driven by PSU stocks booming. In 2025, it gave just 9.8%.
- Quant Focused Fund, a favourite of momentum investors, delivered 30.3% in 2023 but collapsed to just 3.4% in 2025.
- Even the more stable Nippon India Large Cap Fund went from 33.2% to 10.1%.
If you had invested in the “best fund of 2023” at the start of 2024, your returns over the next two years would have been deeply average — or worse.
4. Why Does This Happen? Understanding Mean Reversion
Mean reversion is the tendency of returns to “come back” to long-term averages after extreme highs or lows. In mutual funds, this happens because:
a) Sector Rotation: The sectors that drive returns change every year. PSU stocks drove 2023 returns. Nifty Next 50 led 2024. In 2025, markets consolidated broadly. A fund that was positioned for 2023’s winners was almost certainly not positioned for 2024’s or 2025’s winners.
b) Fund Size Effect: When a fund tops the charts, it attracts massive fresh inflows. A larger corpus is harder to manage for alpha generation. The very success that made the fund popular becomes a drag on future performance.
c) Risk Normalisation: Funds that took higher risks to earn higher returns eventually face years where those risks materialise. Quant Focused Fund is a classic example — high beta, high return in good years, sharp pain in difficult years.
d) Market Tide Effect: In strong bull years, almost every fund rises together. In 2017, even the worst large cap fund returned 21%. In 2021, the lowest performer still returned ~18%. When the tide recedes, individual selection starts to matter — but not in the way that rewards past winners.
5. Index Funds vs Active Funds — Who Won Consistently?
One of the most striking findings from the data is how Nifty 50 index funds held their ground year after year, without dramatic highs or lows:
| Fund Type | 2021 | 2022 | 2023 | 2024 | 2025 |
|---|---|---|---|---|---|
| Nifty 50 Index Funds (avg) | ~25% | ~5.4% | ~21% | ~9.7% | ~11.7% |
| Top Active Large Cap (avg) | ~32% | ~8% | ~28% | ~17% | ~8.5% |
| Bottom Active Large Cap | ~18% | -4.6% | ~18.5% | ~10.9% | ~3.4% |
What this tells us:
- In bull years, top active funds beat index funds
- In lean years, index funds often beat most active funds
- Over a full cycle, Nifty 50 index fund investors experienced less volatility and more predictable outcomes
- Nifty Next 50 index funds were a standout in 2023 (26–28%) and 2024 (27%+) — a reminder that index strategies across different indices can outperform active managers
For 2025 specifically: Most Nifty 50 index funds delivered 11–12%, outperforming many active large cap funds that struggled to cross 8–10%.
6. What Should You Actually Do?
Based on this 10-year analysis, here are practical takeaways for Indian mutual fund investors:
Do NOT chase last year’s top fund. The data is unambiguous. Top-ranked funds of a given year average a significantly lower rank the following year. This pattern held in 2017→2018, 2021→2022, and 2023→2024→2025.
Do NOT confuse a good year with a good fund. A fund that returned 50%+ in a year where its underlying theme went parabolic is not a better fund — it took more concentrated risk. Assess the 5-year and 10-year track record, not the last 1-year rank.
Consider Nifty 50 index funds as your core holding. They are low-cost, consistent, and remove the risk of picking the wrong active manager. Over 10 years, the Nifty 50 delivered 9–12% in most years, with no major negative year in this dataset.
Add Nifty Next 50 for growth exposure. The 2024 data (27%+ returns for Nifty Next 50 index funds) shows the value of diversifying across indices.
Rebalance annually — but based on your goals, not fund rankings. If a fund has dramatically outperformed, it may now be overweight in your portfolio. Rebalancing is smart. Switching entirely to last year’s winner is not.
Stick to regular SIPs. The biggest mistake investors make is interrupting SIPs in bad years and chasing hot funds in good years. The data shows that even in “bad” years like 2018 and 2022, SIP investors who stayed the course did well over the following 1–2 years.
7. Conclusion
The Indian mutual fund industry gives investors an incredible array of choices — over 100 large cap and index funds alone, as we analysed here. But more choice does not mean better outcomes if investors make decisions based on short-term return rankings.
Our 10-year data analysis makes one thing clear: past performance — especially last year’s performance — is the weakest predictor of next year’s returns.
The funds that topped the charts in 2023 have, without exception, delivered significantly lower returns in 2024 and 2025. The market does not reward rear-view-mirror investing.
Instead, focus on:
- A core Nifty 50 index fund
- Consistent SIP contributions
- A time horizon of at least 5–7 years
- Reviewing your portfolio annually based on your financial goals — not fund rankings
As always, consult your SEBI Registered Investment Adviser before making any investment decisions.
Disclaimer: Mutual Fund investments are subject to market risks. Past performance is not indicative of future returns. The data used in this article covers direct plans of large cap and index funds from 2016 to 2025. This article is for educational purposes only and should not be construed as investment advice. Please read all scheme-related documents carefully before investing.

- Best SIP Mutual Funds for ₹ 5,000 Monthly Investment in 2026 (Top 5 Funds) - March 29, 2026
- High Return vs Low Risk Mutual Funds – Which is Better for Investors in 2026? - March 27, 2026
- Why Your SIP May Not Be Enough to Reach Your Financial Goals? - March 26, 2026